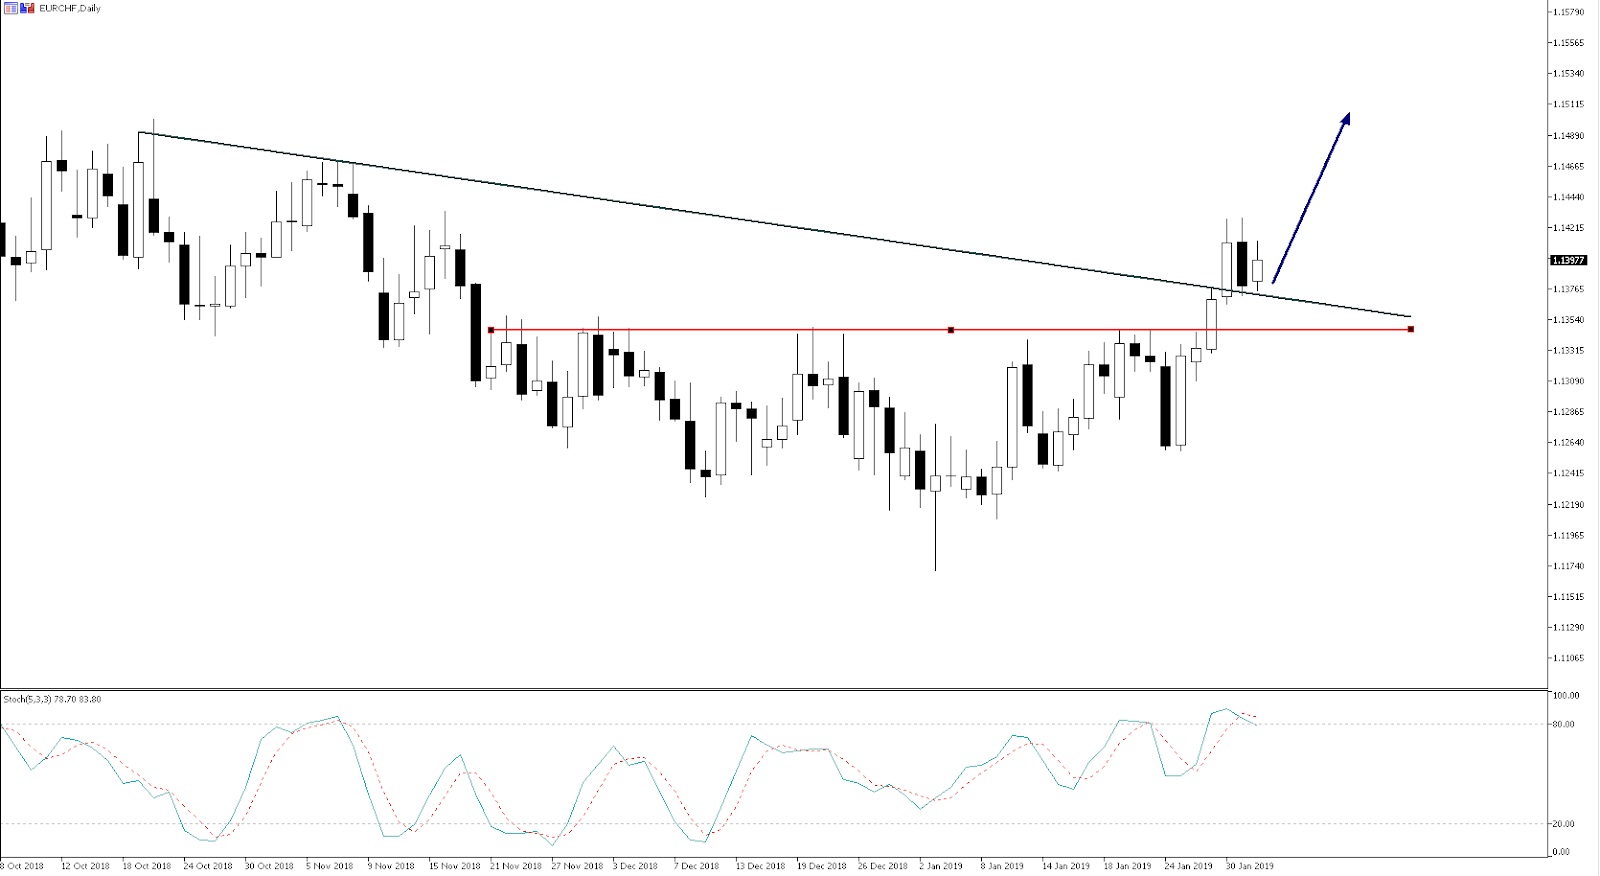
Technical analysis
Technical and price action analysis are two very popular trading studies that both involve the use of charting to comprehend market sentiment, psychology and behaviour. However, both have defined differences.
Always ask questions
A chart can help us to assess the probability of a move higher, lower, or range-bound in the markets. Markets are a series of mostly random events, so as traders our job is to manage risk and assess probability and that's where charting can genuinely help.
When you're starting out using technical, price action analysis or a mixture of both, the first thing you should do is ask yourself a few questions about what the markets are trying to tell you:
- What's the chart pattern saying about the behaviour of active market participants at that moment?
- If a market is trending higher or lower, what's the probability of a continuation of that trend?
- A market may have travelled from A to B, but how can we assess the overall quality of the journey?
While fundamental analysis is interested in the ‘why’, technical and price action analysis is interested in the"‘what’.
What does a chart represent?
This is a simple question but the answer is complex. Whether we're looking at a line chart, a bar chart, Renko or a candlestick chart, all charts are a different portrayal of supply and demand.
A chart aggregates every buy and sell transaction on that market or instrument at any given moment. It factors all known news, as well as what traders expect from future news events, earnings and cash flows before we see the subsequent reaction should the reality be different.
Charts blend all activity from the millions of market participants, human or otherwise. Whether the transaction occurred by the actions of an exporter, an algorithm, a central bank or from a retail trader, a chart blends all this information together to output data traders can assess, analysis and dissect. When you understand and confidently interpret what this information is telling you, it can be incredibly powerful.


