How to quickly identify trading opportunities
There is a common misapprehension that trading needs to be a full-time occupation, but that's not necessarily the case. True you need to be paying attention to what's going on around you, but that does not mean you have to be glued to a screen 24/7.
In fact, if most traders were honest about it and thoroughly analysed their trading performance, they would tell you that they perform best over short periods of time for perhaps just a few hours a day and maybe just for one or two days per week. Yes, there may be exceptions, for example, the "hardcore" scalper stealing ticks for 8 hours a day Monday to Friday. But, thirty years of experience in the markets has shown me that even the talented few, who can do this day to day, burn out, sooner rather than later.
Not everyone wants to pursue or is suited to scalping or short-term trading. Which, in any event, is rapidly becoming the preserve of algorithms, robots and HFTs. My preference is for a swing trading or positional approach to the market. Utilising longer-term trends, key support and resistances as well as moving averages. It's the style of interpreting the markets that I have built up over three decades. It's what I feel familiar with and what works for me.
I think that's the key to fitting trading into your lifestyle. You have to identify what works for you. For myself, it means spending a couple of hours a week looking at charts. It may surprise you to learn that even as an analyst I have a limited attention span for trawling through charts. Ten charts in one sitting are probably more than enough. The key is quality rather than quantity. But where to start?
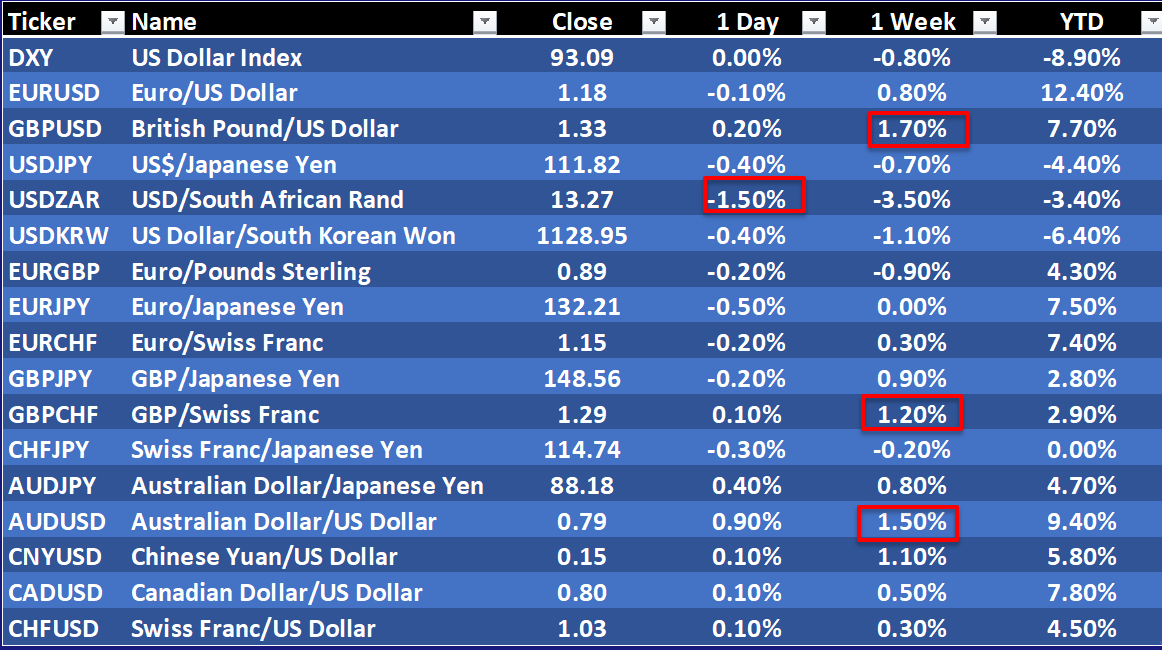
Well, why not kick off with a table that shows you daily, weekly, monthly or even annual price changes. Such as the one below.

This kind of table allows you to compare performance and to look for moves of interest and outliers. For example, this could include instruments which have had a large move or those they have remained largely unchanged, over a given time frame. In the table above, we have highlighted moves in DXY and EURUSD, as well as the move in USDZAR as examples of the type of moves that might warrant further investigation.

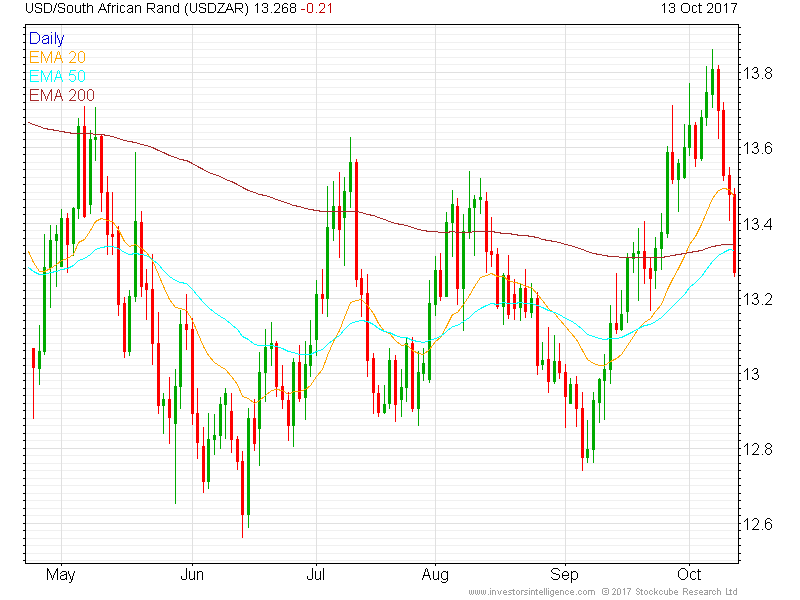
The next stage is to drill down and look at a chart to assess the opportunity. In the case of the USDZAR chart, you would likely want to consider whether the Rand could continue to strengthen or, was now due for a pullback after a very good run. Perhaps you think that it could bounce short term. But if it tested back to and through ZAR 13.20, then you might have your eye on a further move down to ZAR 12.80 for example. If that was your view then you might choose to enter a pending order. In this case, perhaps a sell on stop order to take advantage of any break below 13.20, as and when it happened.
Cryptoburstclients can take this process one step further and utilise Autochartist. Autochartist is a dedicated suite of tools designed to scan the markets and find trade opportunities for you. Autochartist can search for and identify recurring chart patterns and be configured to flag trading opportunities, which should have a higher probability of success based on the historical performance of similar patterns. The software is available as an MT4 plugin or as a web-based platform. What's more, you can use the service on mobile devices, thanks to the availability of Android and iOS apps. The platform is specifically designed to help traders make better decisions, highlight trading opportunities and to save you time. The software is easy to install, and it's available free of charge to our customers and clients. You can find out more about Autochartist"here.
Planning Ahead
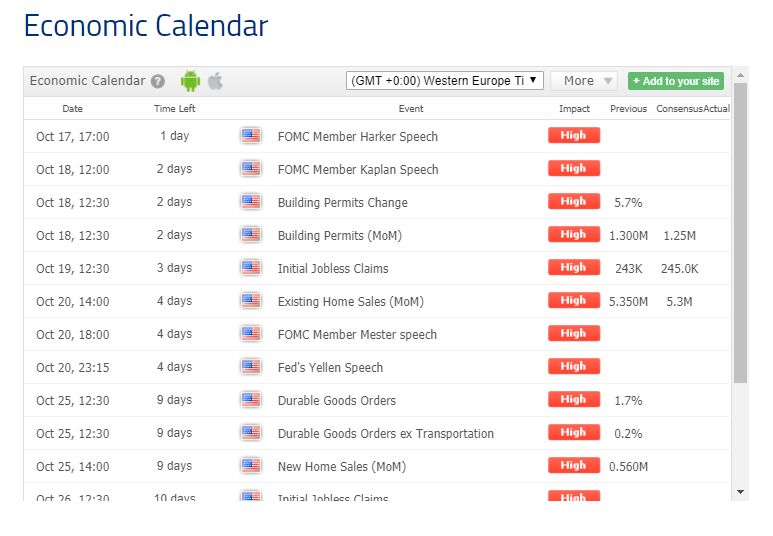
Another way that traders can plan ahead is to pay attention to the economic calendar of events, which can be a very powerful tool if used correctly. Cryptoburstprovides its customers with access to their own economic calendar which can be accessed here. Macroeconomic data follows a known schedule, and the calendar allows us to keep tabs on these events and plan accordingly. The calendar can be filtered by currency and the expected market impact of the release. In this way, we could filter for say only those high impact events that affect GBP and the USD for example. We have done just this in the two lists"below.

There are only a few scheduled important items due out in the UK during this particular period. But rather more high impact data, pending release in the USA, over a similar period. The time and date for these events are displayed on the left-hand side of the table and the default view is GMT. However, users can configure the calendar to a wide variety of time zones by using the drop-down menu. So if you are time constrained, you can plan in advance and be logged in ready to trade at these key points.

Some events, for instance, fall over lunchtimes in Europe or at the end of the European business day. The fact that FX trades globally and continuously, from late on a Sunday evening UK time all the way through to the New York close on a Friday night, creates a very large window of opportunity for traders. Outside of major public holidays, there is almost always something happening in the FX markets. It's really just a question of working out what time of the day suits you to trade and looking for the events that could move the markets when you can be active.
Speaking of activity, it's also a good idea to trade the FX pairs and crosses that will be active in the market when you are. The FX majors tend to trade actively around the clock. Exotic pairs and crosses may be less active but may move more than the majors. If you don't have much time to spend on trading, then the majors are probably the better best for you. Of course, if you're looking for higher volatility, then our CFDs on cryptocurrencies such as Bitcoin could be worth a"look.
Over to You
Following these suggestions should mean that you don't need to spend hours each day pouring over charts. Instead, by working smarter and preparing in advance, you can fit trading into your own individual schedule. Download and check out Autochartist and take the economic calendar for a test drive. I think you will be pleasantly surprised by the results.
For more of Cryptoburstmarket analyst Darren Sinden's content, you can check out his Daily Market Update (key market news in minutes) or follow him on Twitter.

